Charts use the cumulative quarterly chain (0DTE through quarterlies). Refreshed on a background schedule.

Options Curve SPX

@gammacharts
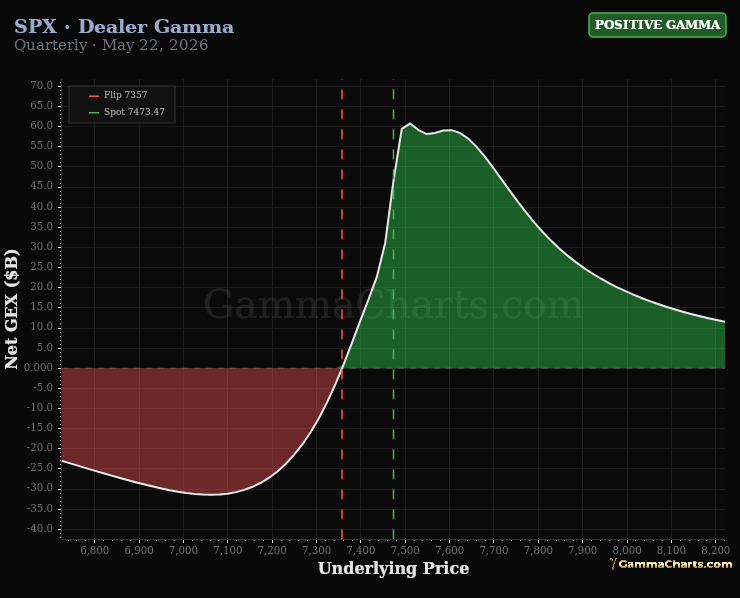
Dealer Gamma

Assumes a uniform 1-point IV shift across all strikes.
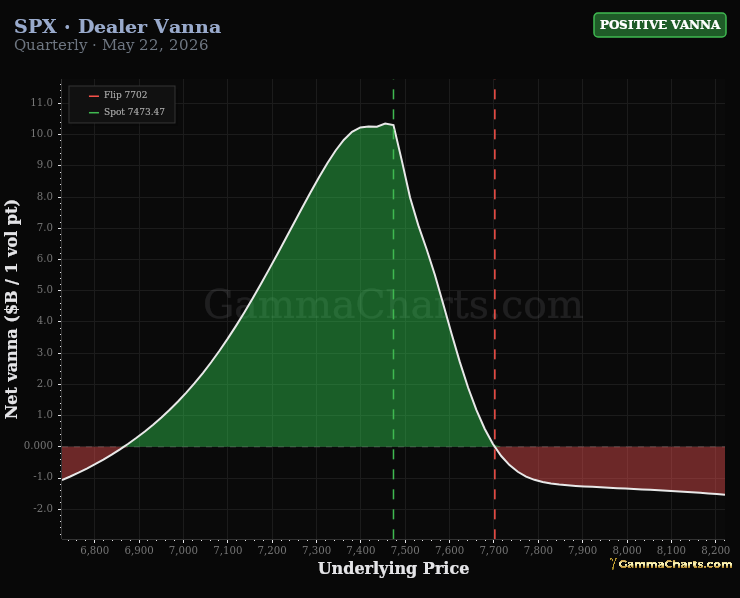
Dealer Vanna

Drift shown per single calendar day; multi-day gaps scale linearly.
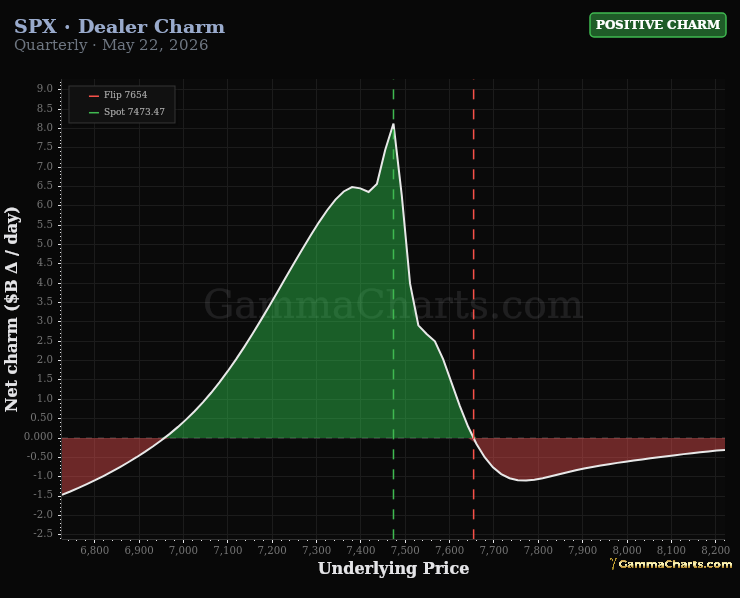
Dealer Charm

All three series in $B; y-axis units differ by greek (see legend).
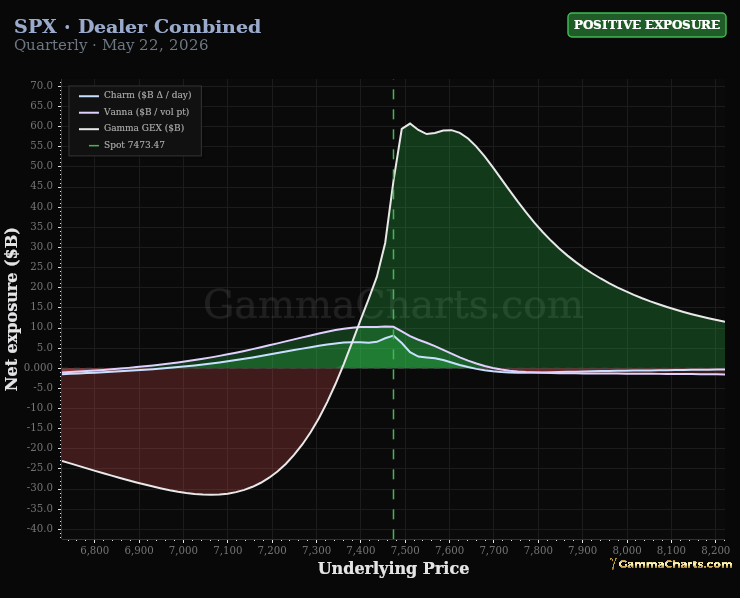
Dealer Combined

What it shows

Estimated dealer Greek exposure by strike: where the book flips sign and how much hedging flow each level implies. Assumptions are noted under each tab.

The tabs

  • Gamma — S-curve of net gamma; zero-cross is the gamma flip (regime change level).
  • Vanna — Delta sensitivity to a parallel 1-point IV shift across strikes.
  • Charm — Delta drift per calendar day with spot and vol held flat.
  • Combined — All three in $B; y-axis units differ by Greek (see legend).

How to use it

  • Mark the flip strike on Gamma first — price above/below defines long- vs short-gamma hedging bias.
  • Use Vanna/Charm when vol or time decay is the driver (event weeks, 0DTE-heavy sessions).
  • Compare to Chain GEX by strike for the same tier — profiles should tell a consistent story.
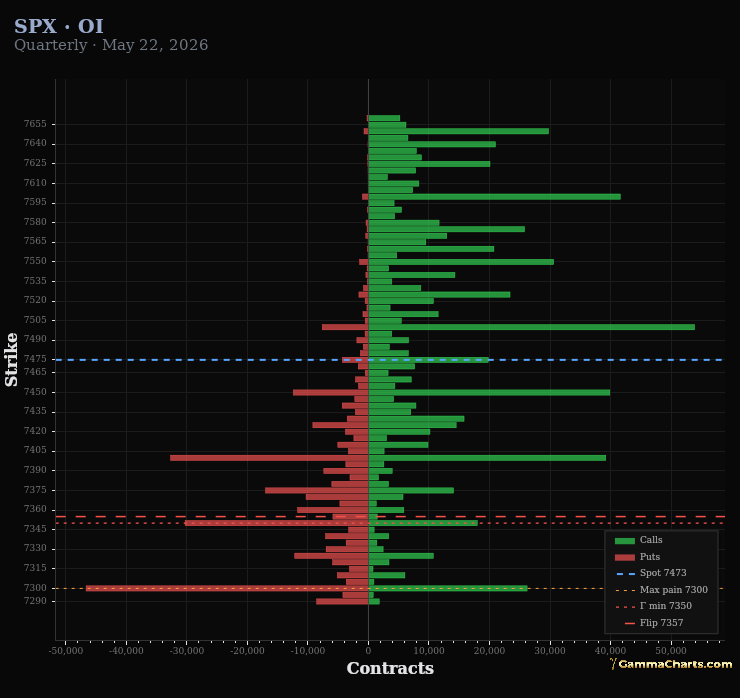
Options Chain

@gammacharts
Open Interest
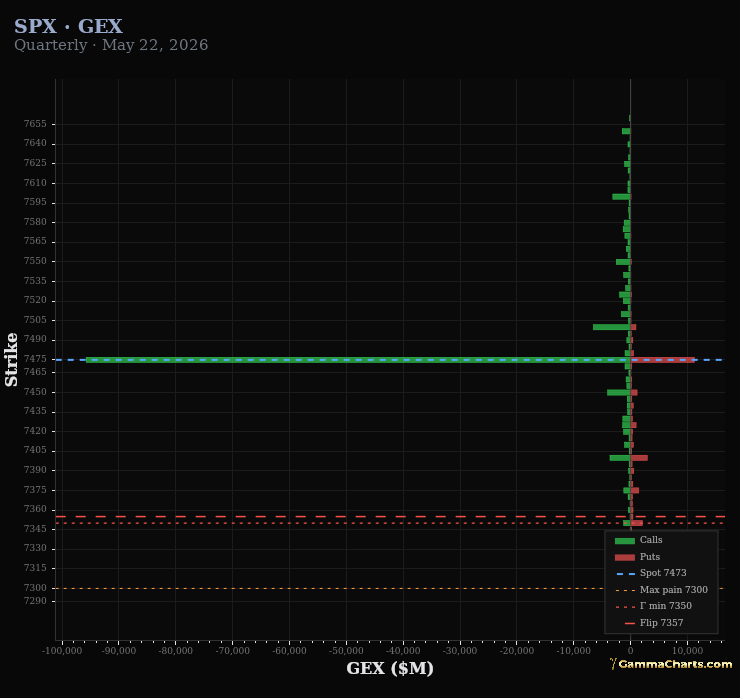
GEX
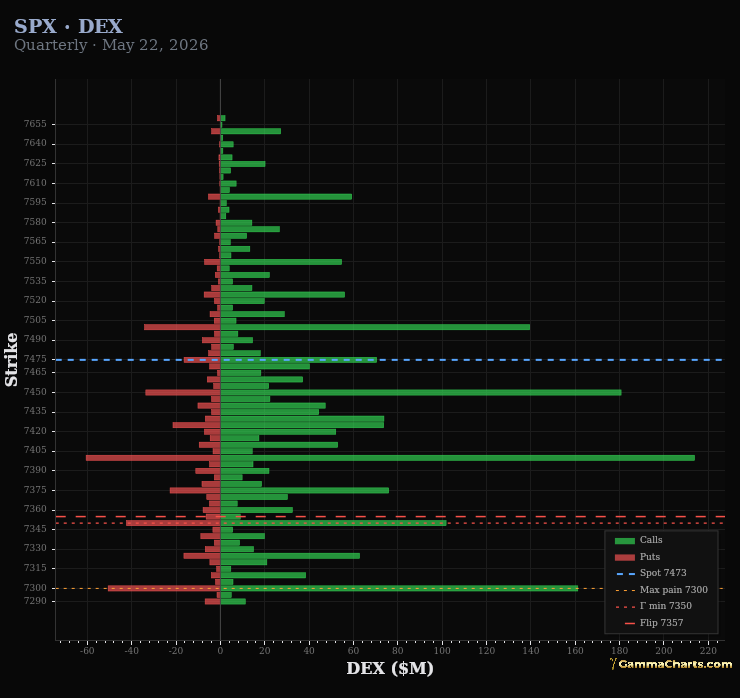
DEX
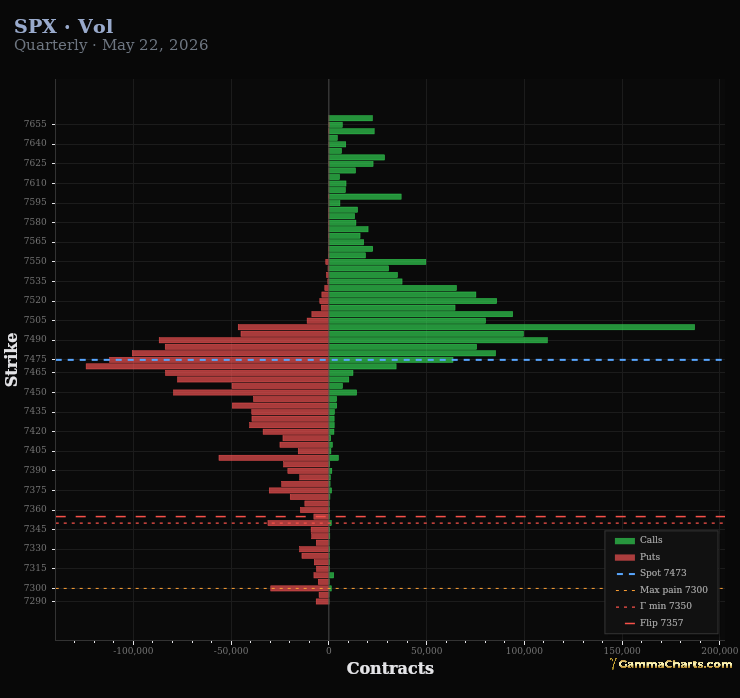
Volume

What it shows

Strike-level open interest, gamma (GEX), delta (DEX), or volume for the selected ticker. The chain is cumulative through quarterly expirations (0DTE + weeklies + monthlies + quarterlies).

Reading the tabs

  • OI — where positioning is stacked; large OI often acts as a magnet into expiration.
  • GEX — dealer gamma by strike; positive = stabilizing zones, negative = move can accelerate through the strike.
  • DEX — directional hedging pressure in delta dollars.
  • Volume — today's activity; confirm whether walls are being defended or rolled.

How to use it

  • Start at spot; read the largest OI/GEX clusters above and below as potential ceilings and floors.
  • Quarterly tier rolls up near-dated and longer-dated positioning into one strike view.
  • Pair with Sigma Bands and Options Curve on this page (same ticker).