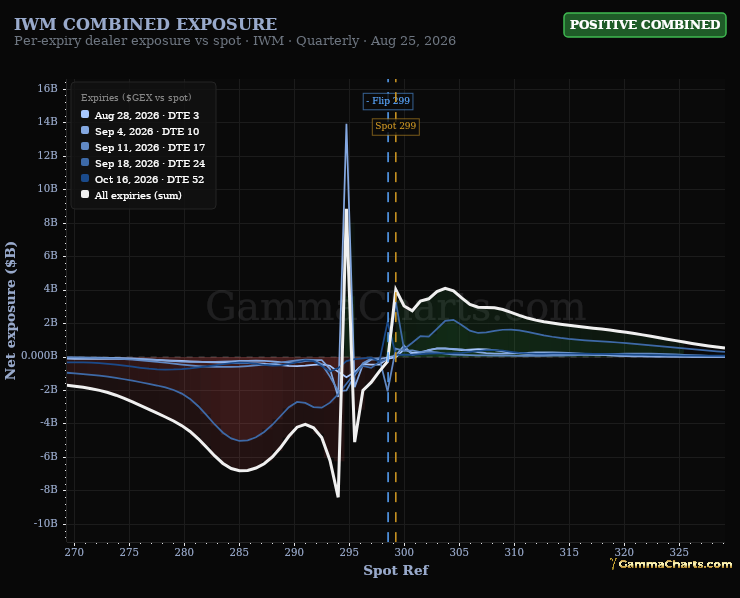
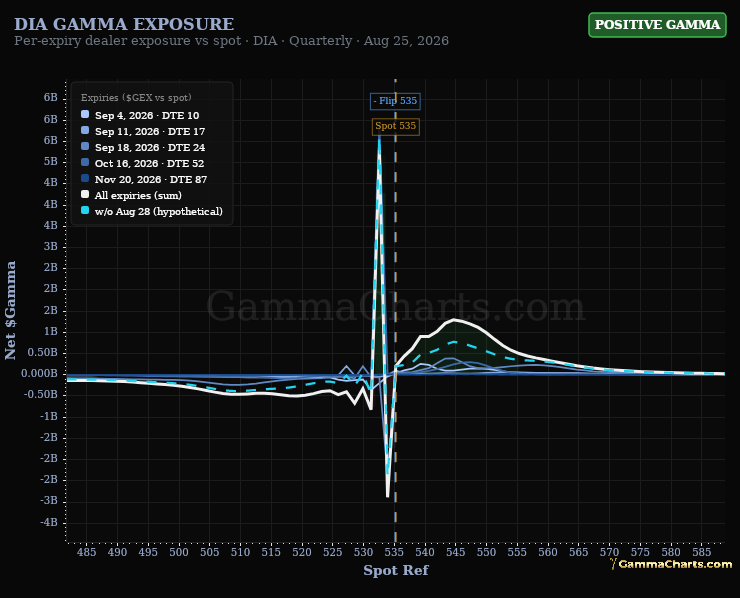
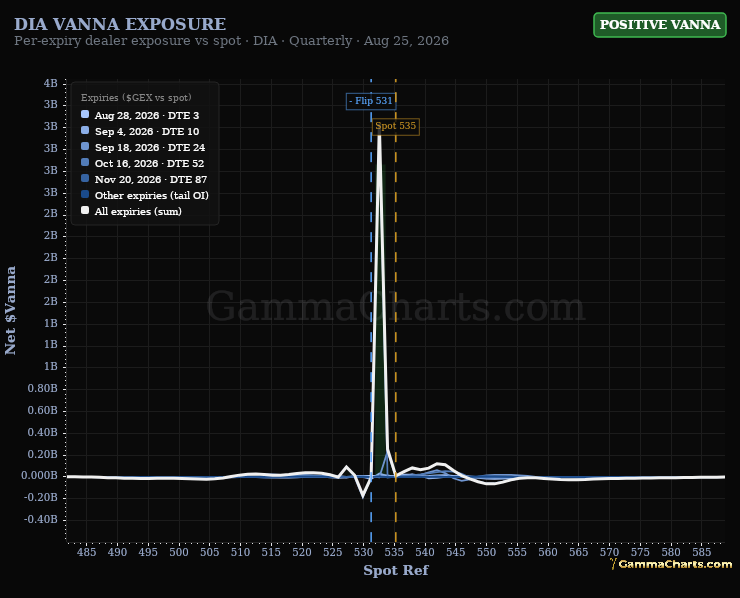
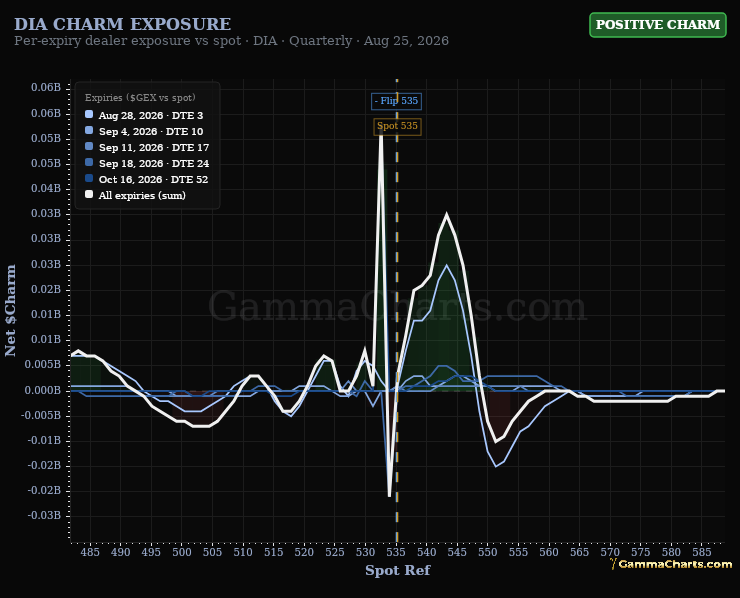
Volatility Summary
@gammacharts
How to use it
Read the composite badge first, then the five panels. When composite and VIX disagree, check VVIX/VIX and term slope — convexity often leads spot VIX.
Volatility composite
- Formula: Robust weighted Z-score — VIX (30%) + Term Slope (25%) + VVIX/VIX (20%) + Dispersion (15%) + Adj Skew (10%). Clamped to [−5, +5].
- Why: Combines five independent volatility dimensions into a single regime number, removing the need to mentally reconcile conflicting signals.
- Signals: > 2.0 → CRITICAL FEAR (red) · > 0.5 → RISK OFF (orange) · < −1.0 → NORMAL (green) · else NEUTRAL (blue).
- Inputs (composite only, not charted): Term Slope (VIX/VIX3M − 1), VXN, VXD, VVIX.
VIX — CBOE Volatility Index
- Formula: CBOE 30-day implied volatility of S&P 500 options (spot level, not a ratio).
- Why: The market's real-money fear gauge — rising VIX means participants are paying more to hedge, which compresses equity multiples and tightens liquidity.
- Signals: < 15 Normal (green) · 15–20 Neutral (blue) · 20–26 Risk Off (orange) · ≥ 26 Extreme (red).
VRP — Volatility Risk Premium (VIX − RV21)
- Formula: VIX minus the 21-day annualized realized volatility of SPY (sample std dev of daily log-returns × √252 × 100).
- Why: Options sellers collect VRP as income; when VRP collapses or goes negative the market is moving faster than priced, and hedges are cheap relative to realized risk.
- Signals (Z-score): ≥ 2.0 Extreme (options very expensive) · ≥ 1.0 Risk Off · ≥ −1.0 Normal · < −1.0 Neutral (options cheap relative to realized moves).
Adj Skew — (SKEW − 100) / VIX
- Formula: CBOE SKEW index minus 100, divided by spot VIX. Centering at 100 converts SKEW to a pure tail-premium measure; dividing by VIX removes the level effect.
- Why: Raw SKEW rises mechanically with VIX; dividing by VIX isolates whether tail protection is unusually expensive relative to broad vol, a signal that large players are positioning for a gap move.
- Signals (Z-score): ≥ 2.0 Extreme · ≥ 1.0 Risk Off · ≥ −1.0 Normal · < −1.0 Neutral (tail risk cheap).
VVIX / VIX — Convexity Demand
- Formula: CBOE VVIX (30-day implied vol of VIX options) divided by spot VIX.
- Why: When this ratio spikes, institutional desks are buying convexity — options on options — which historically leads the VIX itself by hours to days and signals an imminent volatility regime shift.
- Signals (Z-score): ≥ 2.0 Extreme · ≥ 1.0 Risk Off · ≥ −1.0 Normal · < −1.0 Neutral (convexity cheap, vol sellers rewarded).
Dispersion — |VXN − VXD|
- Formula: Absolute spread between Nasdaq-100 implied vol (VXN) and Dow Jones implied vol (VXD).
- Why: When fear is sector-specific (e.g. tech selloff), VXN diverges from VXD; when both collapse toward each other, vol is unusually synchronized — a sign of systemic, broad-market risk rather than rotation.
- Signals (Z-score): ≥ 2.0 Extreme (dislocated sectors) · ≥ 1.0 Risk Off · ≥ −1.0 Normal · < −1.0 Risk Off (compressed — hidden systemic risk).