
US Semis Capex / CPI
About
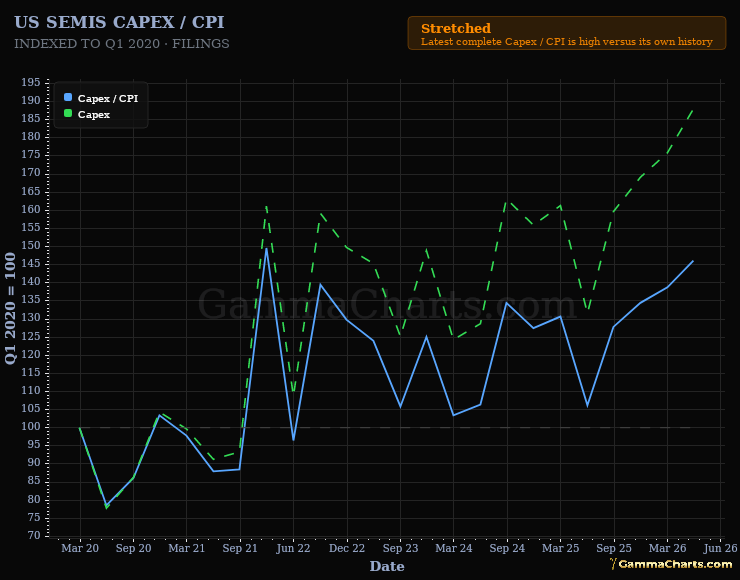
Two indexed lines for a US-listed semiconductor capital spending (capex) basket. This is filings, not the VanEck Semiconductor ETF (SMH). Solid blue is capex divided by the consumer price index (CPI) and dashed green is nominal capex, with the axis starting in 2020.
Instructions
Read the title as US Semis Capex. Treat Stretched as Capex / CPI high versus its own history. The latest quarter stays off the chart until at least 80 percent of trailing-four-quarter spend has filed.
Signals
- Tight - Latest complete Capex / CPI is low versus its own history.
- Typical - Latest complete Capex / CPI sits near its own average.
- Stretched - Latest complete Capex / CPI is high versus its own history.