
DIX / GEX

DIX / GEX

About

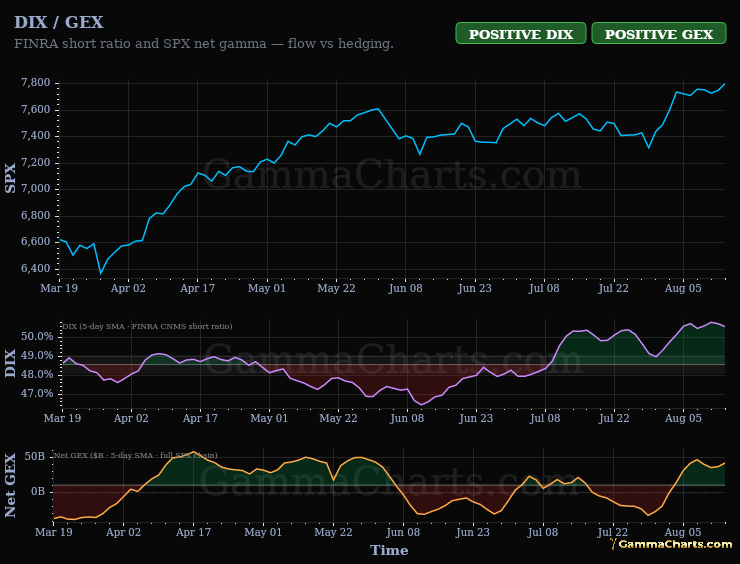
Two flow gauges on one chart: DIX (share of volume reported short) and GEX (aggregate dealer gamma from the SPX options chain). Both come from public FINRA short-volume files and the listed options chain.

Instructions

Read DIX and GEX together. Treat high DIX with positive GEX as buying under a supported tape. Treat high DIX with negative GEX as buying into a tape where dealers amplify moves.

Signals

  • POSITIVE DIX - 5-day short ratio elevated vs its window or above the mean band.
  • NEUTRAL DIX - Ratio near the window mean band.
  • NEGATIVE DIX - Ratio depressed vs window or below the mean band.
  • POSITIVE GEX - 5-day net GEX above the mean band with positive gamma; dampening bias.
  • NEUTRAL GEX - Net GEX near the mean band.
  • NEGATIVE GEX - Below the mean band with negative gamma; amplification bias.

Dispersion Ratio

Dispersion Ratio

About

The implied volatility of the S&P 500 measured against the implied volatility of its members, shown as the DSPX / COR3M ratio. Use it to see whether index vol is cheap or rich vs single-name vol.

Instructions

Note a high ratio says the market fears one coordinated move more than it fears individual company events, so macro is in charge. Note a low ratio says single stocks price more risk than the index, which is the environment index vol sellers prefer. Watch the two lines diverge rather than either level alone.

Signals

  • Extreme Setup - Ratio at window highs with COR3M in the basement. Highest decoupling stress.
  • Decoupled Regime - Elevated ratio with low correlation index. Stock-picker's tape.
  • Correlation Collapse - Implied correlation at window lows.
  • Dispersion Lead - DSPX/COR3M elevated; idiosyncratic vol rich.
  • Compressed - Low dispersion premium; macro lockstep.
  • Neutral - Mid-range; no extreme skew.
  • NO DATA - Insufficient dispersion history.

Implied vs Realized Vol

Implied vs Realized Vol

About

Near-dated index implied volatility against realized volatility, with the gap scored on this market's own history. Shows whether protection is rich or cheap relative to what has printed.

Instructions

Read the badge as rich or cheap vs this market's trailing distribution. Treat top-decile spreads as expensive protection. Treat realized above implied as the state that hurts short-vol positions.

Signals

  • VOL RICH - Spread in the top decile of its trailing window.
  • ABOVE NORMAL - Spread above the 70th percentile.
  • NORMAL - Mid-range.
  • BELOW NORMAL - Spread below the 30th percentile.
  • VOL CHEAP - Spread in the bottom decile.
  • RV EXCEEDS IV - Realized above implied today; overrides percentile bands.
  • BUILDING HISTORY - Fewer than one year of scored sessions.

Weighted S&P A/D

Weighted S&P A/D

About

Cap-weighted advance/decline breadth for S&P 500 stocks plotted alongside equal-weighted breadth, showing where capital is flowing versus simple stock count. Cap-weighted breadth adapts the advance/decline line that dates to the 1930s.

Instructions

Compare the cap-weighted histogram to the equal-weighted line. Note when both are positive and cap-weight leads, broad participation confirms the trend. Note when they diverge - cap-weight positive but equal-weight flat or negative - mega-cap stocks are carrying the index while the majority weaken.

Signals

  • Hold long - Both readings positive; cap-weight leading. Do not fade.
  • Hold short - Both readings negative; cap-weight leading down. Do not fade.
  • Regime flip - Both crossed above zero; early bull trigger.
  • Regime flip - Both crossed below zero; early bear trigger.
  • Lagging - Histogram diverging from the equal-weight line; weak follow-through.
  • Mixed - Signs diverging; cut size.
  • Neutral / Compression - Flat or near zero; chop risk.

CoT Positioning

CoT Positioning

About

Weekly CFTC Commitments of Traders speculative positioning drawn on the S&P 500 price spine, with a modelled trend-follower exposure estimate and a forward fan. Built from the CFTC weekly report, which is published Friday for the prior Tuesday. Positioning is aligned to its public release date so the chart does not front-run the weekly report.

Instructions

Read positioning against price rather than on its own. Note both rising together means the trend has growing speculative length behind it. Note price rising while positioning falls means fewer participants are carrying the move, which raises the odds of a squeeze or an unwind.

Signals

  • Asset mgr buying - Asset managers added over the trailing four weeks.
  • Asset mgr selling - Asset managers cut over the trailing four weeks.
  • Asset mgr flat - Four-week flow inside the neutral band.

SPX Pattern Radar

Price
Regime

About

Finds past SPX windows whose price path and Treasury yields match today. Reports how those analogs traded after the match.

Instructions

Read the red SPX line against the gold 10-year yield. Treat the shaded box as today's window. Treat white dots as past matches and read the subtitle for similarity and what followed.

Signals

  • STRONG ANALOG - Best historical match similarity is at least 70%.
  • TYPICAL PATTERN - A usable analog exists below the strong threshold.
  • UNPRECEDENTED - No close analog in the available history.

Greek Cycle Support

Gamma
Vanna

About

Dealer gamma (or vanna) in contracts through the next monthly OPEX, compared with history at the same days-to-OPEX. The chart compares the current session to past months at the same days-to-OPEX phase.

Instructions

Read today's line against the median for this phase of the cycle. Treat ABOVE AVG as a heavier dealer greek book into this OPEX, so hedge flows into expiry run hotter. Treat BELOW AVG as a lighter dealer book for this phase, so forced hedging into the print is muted.

Signals

  • ABOVE AVG - Front-cycle dealer greek is high vs same days-to-OPEX history. Hedge flows into expiry are heavier than usual.
  • TYPICAL - Near the historical median for this phase.
  • BELOW AVG - Light vs history for this phase. Hedge pressure into expiry is muted.
  • BUILDING - Same-phase history is still too short to classify.

Tabs

  • Gamma - Front-cycle dealer gamma vs same days-to-OPEX median.
  • Vanna - Front-cycle dealer vanna vs same days-to-OPEX median.