
Shiller CAPE
About
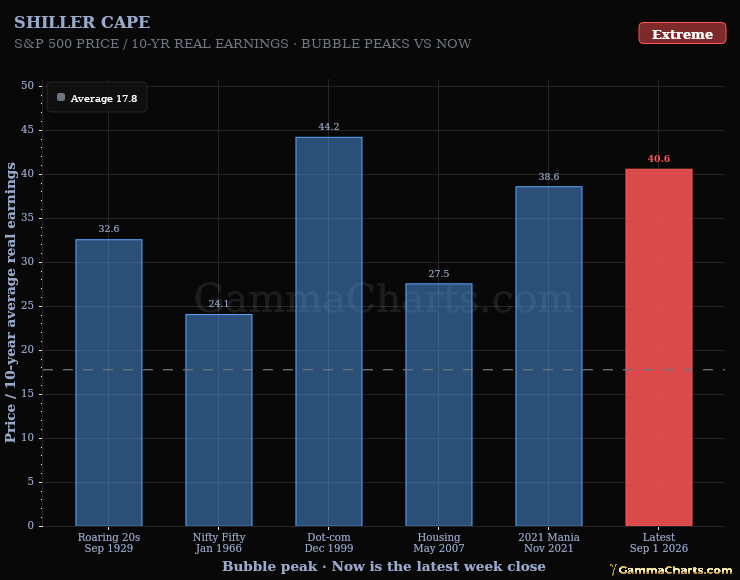
Bars show Robert Shiller's cyclically adjusted price-earnings ratio (CAPE), S&P 500 price divided by the ten-year average of inflation-adjusted earnings, at the peak month of each past market bubble since 1881. The last bar is Now: the latest CAPE month carried forward to the latest weekly S&P 500 close. Dashed grey is the average of every month since 1881, and the badge ranks Now against all of them.
Instructions
Read the Now bar against the bubble bars to its left and against dashed grey. Check the date under Now: it is the latest Friday close, and it shows the latest CAPE month instead when the S&P 500 has no close after that month ended. Treat the weekly move as price only: Shiller posts each month's CAPE after the month ends, and the earnings average moves slowly.
Signals
- Cheap - Now ranks below the 25th percentile of every month since 1881.
- Fair Value - Now ranks from the 25th to below the 75th percentile.
- Rich - Now ranks from the 75th to below the 95th percentile.
- Extreme - Now ranks in the top 5 percent of every month since 1881.
Symbols
- Shiller ie_data.xls - Robert Shiller's monthly S&P Composite price, earnings, consumer price index (CPI), and CAPE since 1871, from shillerdata.com. Supplies every monthly CAPE value.
- ^GSPC - S&P 500 daily closes, via Yahoo. Carries the latest CAPE month forward to the latest week close for the Now bar.