
SPX Pattern Radar
About
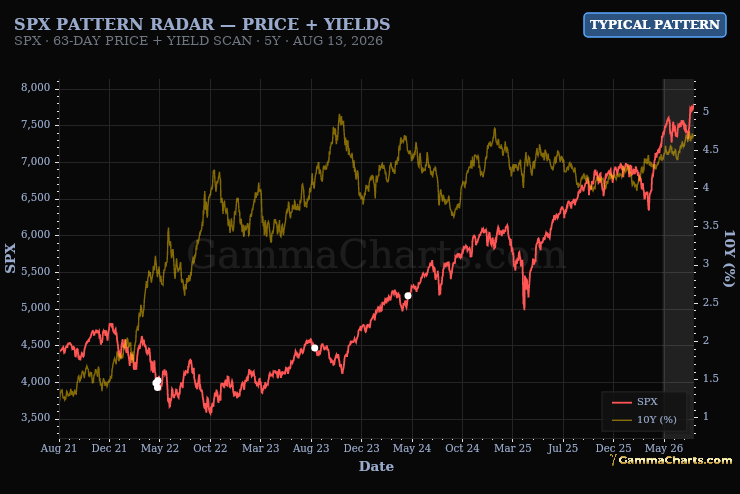
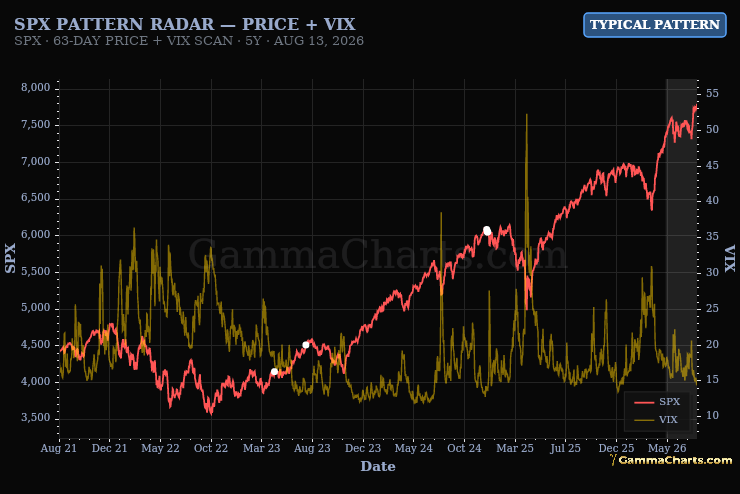
Finds past SPX windows whose price path and Treasury yields match today. Reports how those analogs traded after the match.
Instructions
Read the red SPX line against the gold 10-year yield. Treat the shaded box as today's window. Treat white dots as past matches and read the subtitle for similarity and what followed.
Signals
- STRONG ANALOG - Best historical match similarity is at least 70%.
- TYPICAL PATTERN - A usable analog exists below the strong threshold.
- UNPRECEDENTED - No close analog in the available history.