
Sector Rotation
About
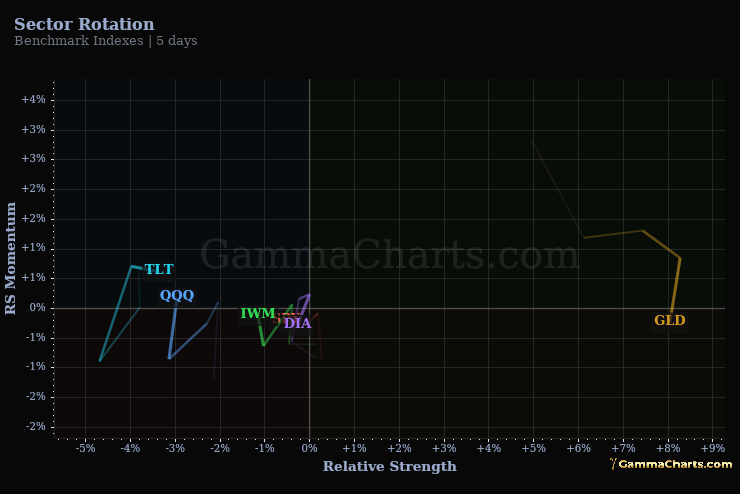
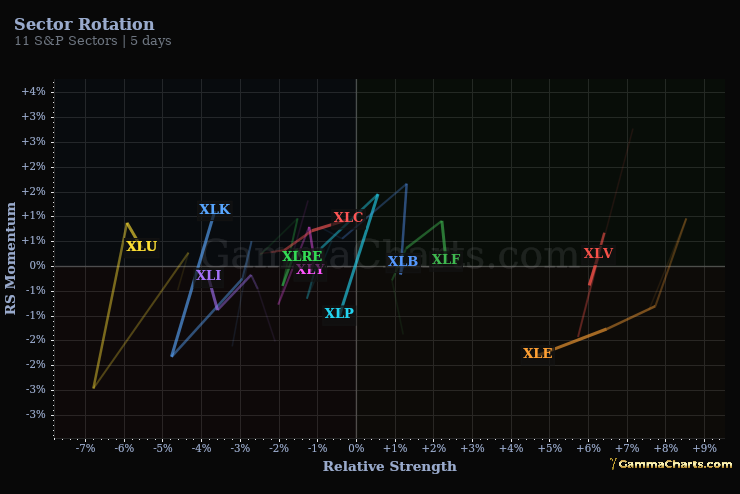
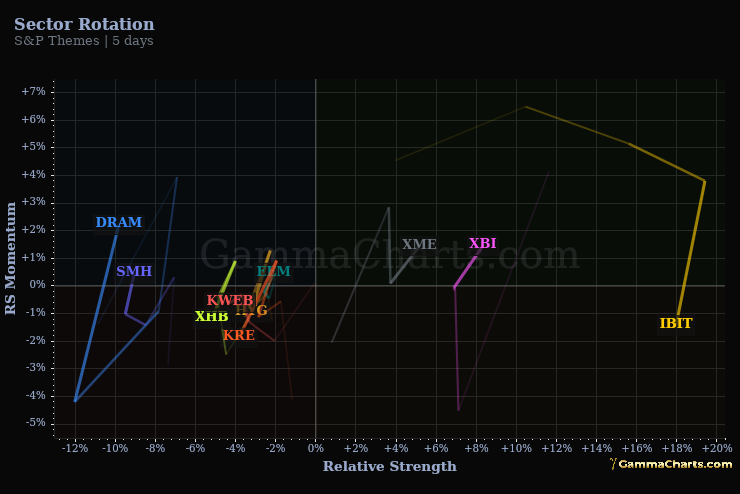
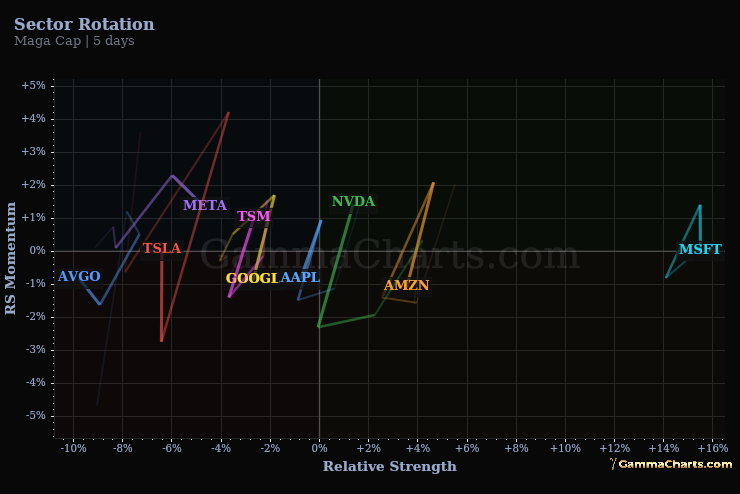
The Relative Rotation Graph plots each security's relative strength against its relative momentum versus a benchmark, with a trail showing the recent rotation path. Julius de Kempenaer developed the Relative Rotation Graph at Bloomberg in the early 2000s.
Instructions
Read the quadrant position against the benchmark to gauge relative cycle stage. Note names rotating clockwise from Improving into Leading signal emerging leadership; names in Weakening signal late-cycle exhaustion. Watch the trail direction and speed for rotation momentum.
Signals
LEADING
Outperforming the index and momentum is positive. Established relative strength.
WEAKENING
Still outperforming, but momentum is fading. Often late in the relative cycle.
LAGGING
Underperforming with negative momentum. Weakest relative phase; watch for bottoming into Improving.
IMPROVING
Underperforming but momentum turning up. Often the earliest rotation entry.
Tabs
- Benchmark Indexes - SPY, QQQ, IWM, TLT, GLD. Cross-asset leadership: large-cap vs growth vs small-cap, plus duration and gold as risk-off anchors. Use this tab for macro regime - which beta sleeve is winning.
- 11 S&P Sectors - GICS sector ETFs (XLK, XLF, XLV, XLE, etc.). Classic sector rotation wheel. Use this tab for cyclical vs defensive positioning and where institutional flow is rotating within the index.
- S&P Themes - Thematic sleeves: semis (SMH), credit (HYG), EM (EEM), biotech (XBI), regional banks (KRE), homebuilders (XHB), metals (XME), bitcoin (IBIT), China internet (KWEB), and DRAM. Use this tab for risk-on / risk-off themes beyond plain sector labels.
- Maga Cap - Mega-cap single names (META, MSFT, GOOGL, TSLA, AMZN, NVDA, AAPL, TSM, AVGO). Tracks whether index leadership is narrowing into a handful of names or broadening out. Pair with RSP/SPY on Macro for participation context.