
US Capex / CPI
About
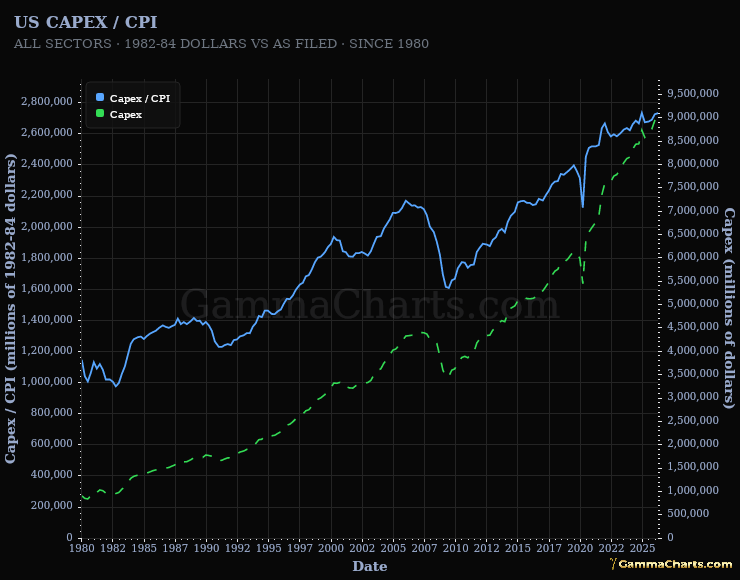
Two lines for all-sectors US capital expenditures, from 1980 to the latest quarter: solid blue is capex divided by headline consumer price index (CPI) on the left axis, dashed green is capex as filed on the right. Capex is the Federal Reserve Z.1 series BOGZ1FA895050005Q, millions of nominal dollars at a seasonally adjusted annual rate, and CPI is BLS CPIAUCSL on its 1982-84 = 100 base. Both axes start at zero and each is scaled to its own line, so compare the two slopes rather than the distance between them.
Instructions
Read each line against the axis in its own colour, blue on the left and green on the right. Compare blue with the 1980s and with the 2000 and 2007 peaks to see whether real capital spending grew or only kept pace with prices. Pair it with the hyperscaler Capex / CPI card to see how much of a recent rise comes from one basket of companies.
Signals
- Real expansion - Blue rises, so capital spending outpaces CPI.
- Flat in real terms - Blue holds its level while green climbs, so prices absorb the increase.
- Real contraction - Blue falls, so real capital spending shrinks.