
Yield Curve
About
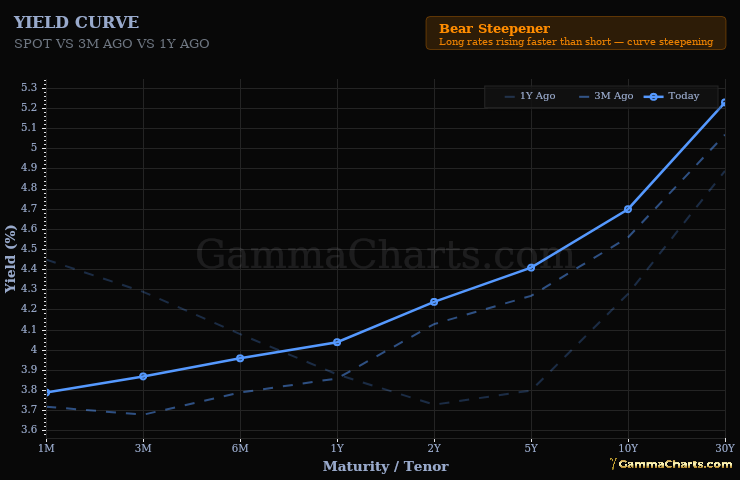
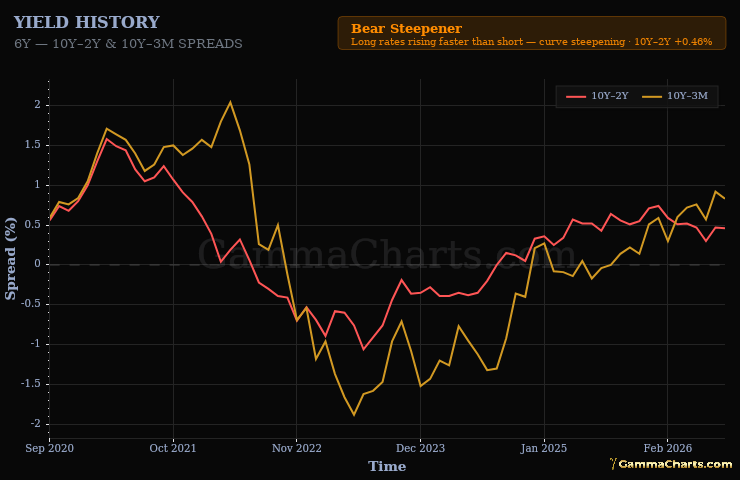
Treasury yields across maturities, with a badge for how the 2-year and 10-year have moved together over the last three months. The 10Y-3M shape remains a New York Fed recession-probability input.
Instructions
Read the curve shape for the slow signal and the badge for the near-term move. Treat an inverted curve as the bond market pricing lower rates ahead. Read the badge for which end of the curve is driving the move.
Signals
Bull Steepener
Short rates falling faster than long - curve steepening while rates decline.
Bear Steepener
Long rates rising faster than short - curve steepening while rates rise.
Bull Flattener
Long rates falling faster than short - curve flattening while rates decline.
Bear Flattener
Short rates rising faster than long - curve flattening while rates rise.
When history is too short to classify dynamics (common on the History tab), the badge falls back to:
- Inverted - 10Y-2Y below zero.
- Normal - 10Y-2Y above zero.
Tabs
- Spot Curve - Cross-section of Treasury yields by maturity with the steepener / flattener badge.
- History - S&P 500 price with background yield curve regime shading and lower Treasury yield spread history from 2020.